This Script Tip Friday is brought to you by Christoffer Eriksson, who is an Application Developer at EDRMedeso, an Ansys Elite Channel Partner.

Christoffer's tip will cover how to plot design point (DP) results using PyDPF. When running parametric simulations, it can often be of value to examine results(s) from each design point to validate the inputs from a graphical point of view (i.e., to get a quick overview). This PyDPF example shows a simple way to plot a deformation result for four design points (DP) in the same window.
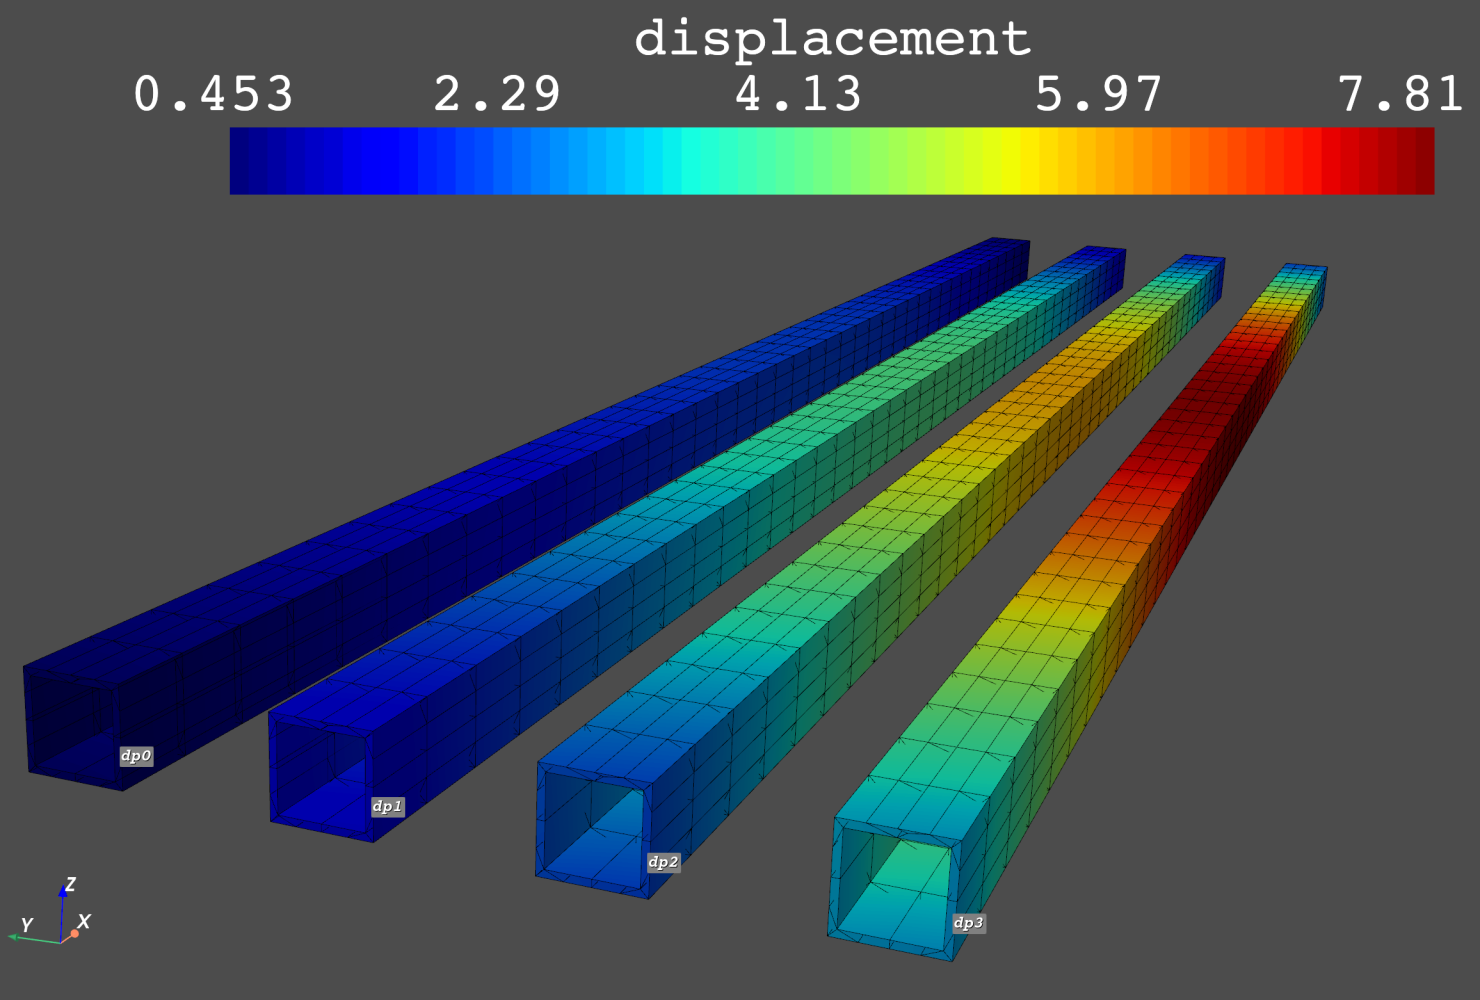
The plot below shows the displacement result on the named selection 'MYBODY' for DP0. The aim here is to plot the displacement result on 'MYBODY' for all 4 DPs (dp0, dp1, dp2 and dp3) and line up the results next to each other.

Import the DPF-Core module and the Dpf-Plotter.
from ansys.dpf import core as dpf
from ansys.dpf.core.plotter import DpfPlotter
import os
plotter = DpfPlotter()
Then, extract DP folders from project_files and place in dictionary.
projectFolder = "C:\\Temp\\dpresultsDPF_files\\"
fileList = os.listdir(projectFolder)
dp_dict = {}

for fileName in fileList:
  if 'dp' in fileName:
      dp_dict[fileName] = projectFolder + fileName + "\\SYS\\MECH\\file.rst"
Next, loop over all DPs.
for i, dp in enumerate(dp_dict.keys()):
    ...
Extract current DP and read the corresponding result file.
    ...
    rstFilePath = dp_dict[dp]
    model = dpf.Model(rstFilePath)
    Names Selection scoping to 'MYBODY'

    ns_op=dpf.operators.scoping.on_named_selection(requested_location='Element',named_selection_name='MYBODY',data_sources=model)
    ...
Extract global mesh.
    ...
    myGlobalMesh = model.metadata.meshed_region
    ...
Create 'skin mesh' to reduce computational time (more necessary when plotting results from different time steps, since we then need to copy the mesh).
    ...
    mesh_skin = dpf.operators.mesh.skin()
    mesh_skin.inputs.mesh.connect(myGlobalMesh)
    mesh_skin.inputs.mesh_scoping.connect(ns_op)
    result_mesh = mesh_skin.outputs.mesh()
    ...
Get displacement field for current DP from displacement fields container
    ...
    displacement_operator = model.results.displacement()
    displacement_operator.inputs.data_sources.connect(model)
    displacement_operator.inputs.mesh.connect(result_mesh)
    displacement_set = displacement_operator.outputs.fields_container()[0]
    ...
Translate the mesh (here in 100*i * (-Y) direction). The mesh from DP0 (the first DP) will be kept in its original place since i = 0. DP1 will be translated -100*1 = -100 mm in negative Y, DP2 will be translated -100*2 = -200 mm in negative Y,
    ...
    overall_field = dpf.fields_factory.create_3d_vector_field(1, dpf.locations.overall)
    overall_field.append([0.0, -100*i, 0.0], 1)
    coordinates_to_update = result_mesh.nodes.coordinates_field
    add_operator = dpf.operators.math.add(coordinates_to_update, overall_field)
    coordinates_updated = add_operator.outputs.field()
    coordinates_to_update.data = coordinates_updated.data
    ...
Add current DP field result (displacement_set,result_mesh) to plotter.
    ...
    plotter.add_field(
            displacement_set,
            result_mesh,
            show_max = False,
            show_min = False,
            label_text_size = 15,
            label_point_size = 1,
            )
    ...
Place a label on any node (here, the first node in the result_mesh.nodes list) with text = str(dp)
    ...
    node = [result_mesh.nodes[0]]
    label = [dp]

    plotter.add_node_labels(
        node,
        result_mesh,
        label,
        italic=True,
        bold=True,
        font_size=26,
        text_color="white",
        font_family="courier",
        shadow=True,
        point_color="grey",
        point_size=1,
        )
    ...
Plot the final solution.
plotter.show_figure(show_axes=True)