Effortless Visualization of Simulation Data and embed it with Modern Web Apps
Introduction
The Ansys Fluent Visualization Python Module is a dynamic client library that allows you to produce visually captivating depictions of fluid dynamics simulations using Ansys Fluent. This tool employs the features of PyVista and Matplotlib to offer a user-friendly interface for generating 3D plots, contour plots, and interactive visualizations. Regardless of whether you're a computational fluid dynamics student or an experienced engineer, the Ansys Fluent Visualization Python Module can assist you in extracting valuable insights from your simulation data by presenting it in a manner that is both intuitive and informative. This module facilitates the export of 3D Interactive Graphics for mesh visualization, contour plots, etc., as python objects, GLTF files (GL Transmission Format), vtk, and HTML. The key advantages of 3D visualization in the browser are its ability to export the model, simulation data as HTML or other mentioned formats, making it effortless to share and embed in web pages and web applications. This capability can be leveraged to present data with modern Web Apps, Enterprise Engineering Workflows in general.
Let's explore the realm of fluid dynamics visualization and discover the potential of the ANSYS Fluent Visualization Python Module!
Overview
In this article, we will explore the various features of the Ansys Fluent Visualization Python Module and guide you on how to export 3D visualizations as HTML. For a basic understanding of the installation and setup process, and to delve into some of the module's advanced features, including a comprehensive example, please refer to the latest release documentation. Additionally, this article includes code snippets based on the version ansys-fluent-visualization 0.7.1, which is available on the Python Package Index (PyPI), a repository of software for the Python programming language.
Features
In this article, we will delve into the following key features of the Ansys Fluent Visualization Python Module:
- Graphics object for visualizing 3D meshes and contour plots of simulation data.
- A demonstration on how to export 3D visualizations as HTML using PyVista Plotter.
- XYPlot object for creating XY plots of simulation data that utilize the capabilities of Matplotlib.
Code Examples
Note: Please installation the following libraries, to get the expected outcome from these code snippets.
Required modules
- ansys-fluent-core
- ansys-fluent-visualization
- trame
- panel
- ipywidgets
Importing the Module
To get started, we need to import the module. We can do this by using the following code:
import ansys.fluent.core as pyfluent
from ansys.fluent.core import examples
from ansys.fluent.visualization import set_config
from ansys.fluent.visualization.matplotlib import Plots
from ansys.fluent.visualization.pyvista import Graphics, pyvista_windows_manager
Set visualization configuration
set_config(blocking=True, set_view_on_display="isometric")
Downloading the example file and reading the case and data files
import_case = examples.download_file(
    filename="manifold_solution.cas.h5", directory="pyfluent/exhaust_manifold"
)

import_data = examples.download_file(
    filename="manifold_solution.dat.h5", directory="pyfluent/exhaust_manifold"
)
solver_session = pyfluent.launch_fluent(precision="double", processor_count=6, mode="solver", cleanup_on_exit=True, show_gui=True)
solver_session.file.read_case_data(file_type="case-data", file_name=import_case)
Create Graphics object
graphics = Graphics(session=solver_session)
Visualize the mesh
mesh_viz = graphics.Meshes["mesh_viz"]
mesh_viz.show_edges = True
lst_all_walls = mesh_viz.surfaces_list.allowed_values
mesh_viz.surfaces_list = lst_all_walls
mesh_viz.display()
Export HTML for Mesh Visualization using Plotter object
pyvista_windows_manager.open_window("mesh_visualization")
active_window = pyvista_windows_manager.get_window("mesh_visualization")
active_window.show_window = False
active_window.post_object = mesh_viz
active_window.plot()
plotter = pyvista_windows_manager.get_plotter("mesh_visualization")
plotter.window_size = [1920, 1080]
plotter.export_html('mesh_visualization.html', backend='panel')
Create a Plane object
surf_mid_plane_x = graphics.Surfaces["mid-plane-x"]
surf_mid_plane_x.definition.type = "iso-surface"
iso_surf2 = surf_mid_plane_x.definition.iso_surface
iso_surf2.field = "z-coordinate"
iso_surf2.iso_value = -0.05
Create a Contour object using Plane object
temperature_contour = graphics.Contours["contour-temperature"]
temperature_contour.field = "temperature"
temperature_contour.surfaces_list = ["mid-plane-x",]
temperature_contour.display()
Export HTML for Temperature Contour using Plotter object
pyvista_windows_manager.open_window("temperature_contour")
active_window = pyvista_windows_manager.get_window("temperature_contour")
active_window.show_window = False
active_window.post_object = temperature_contour
active_window.plot()
plotter = pyvista_windows_manager.get_plotter("temperature_contour")
plotter.window_size = [1920, 1080]
plotter.export_html('temperature_contour.html', backend='panel')
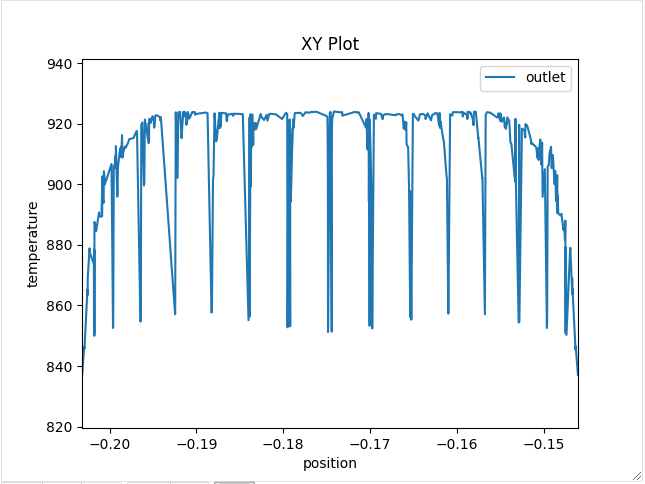
Create Plots object to create XYPlot
plots_session1 = Plots(solver_session)
Create XYPlot
p1=plots_session1.XYPlots["p1"]
p1.surfaces_list = ["outlet"]
p1.y_axis_function = "temperature"
p1.plot("p1")
Conclusion
To sum up, the Ansys Fluent Visualization Python Module is a highly valuable resource for individuals engaged in computational fluid dynamics. It offers a robust and easy-to-use Python interface for producing striking visualizations of fluid dynamics simulations. The capability of exporting 3D visualizations as HTML or other formats makes it exceptionally convenient to share and embed simulation data in web pages and applications. By delving into the essential features of this module, we trust that this article has equipped you with a deeper comprehension of its possibilities and how it can enhance your work in fluid dynamics visualization.
