Advent of code in review
At the time of writing, we are coming to the end of January/start of February and it is just about time for an Advent of Code 2023 retrospective. This year we had ~80 Ansys employees (so far) tackle at least one of the 50 challenges; of course, anyone at Ansys is welcome to retroactively go back and tackle all the challenges after advent as well, so those numbers may still change. The event may primarily last through advent, but it is not exclusive to it and since next year is the 10th anniversary of the event the opportunity will arise to get into the prestigious 500 star club. Each year offers 50 stars, and the first event was in 2015, so by the end of 2024 there will be a maximum number of stars available of 500. I think a lot of people will be gunning for that achievement as we look ahead.
But anyway, here and now, advent of code 2023 is complete! We had a great turnout this year and a lot of discussions around the event.
Nine people completed every challenge on every day, and a huge congratulations to all of them! It is an achievement in and of itself to finish at all so I want to extend a huge congrats to everyone that got that far. An additional round of applause is deserved for all those who took on the Advent in "hard mode" by doing it in a new language. I used Rust myself and learned a lot about it in the process.
Retrospective
I am breaking this section into two parts. First is a short perspective piece about how everything felt for me as a participant, but then in part 2 I have broken out the Python to do some more objective comparisons with previous years!
Part 1: my perspective
I think this year felt a lot harder than previous years to me (having done 2022 at the time and gone back to tackle some of 2021 since as well). Especially since it started off hard with a somewhat infamous edge-case in the input that wasn't explicitly tested in the example (should eightwo be parsed as 8, 2 or just 8 or just 2?). Strange edge-cases in the input would become a theme this year. Additionally, as the days progressed I felt like this year's specialist subject was Lowest Common Multiple or remainder theorems. I felt like I encountered problems requiring that kind of solution disproportionately more, as did my friends that were doing it with me. In contrast, last year, breadth-first and depth-first searches cropped up more than anything else with a friend of mine saying he implemented them 5 separate times over the course of advent. I am sure I tackled LCM-like problems at least 3 separate days this time. Of course, I am also really bad at LCM problems, so it's possible I notice them more.
When considering the "hardest" days overall, though, quite a few stand out significantly to me.
- Day 1
- Day 12
- Day 21
Day 1 was more proportionally hard for where it was, than traditionally tricky. It took me several hours to complete, as well as a lot of thinking and puzzling, whereas compare that to day 1 the previous year, which I solved in under 15 minutes, and essentially knew how to solve the problem as I read it. 15 minutes is actually a pretty slow time on the whole for a Day 1. It was a big surprise to be hit with that kind of difficulty on Day 1. It introduced a niggling doubt that I was missing something that everyone else knew (although my friends assured me they were missing it too). TYhis doubt never quite sent away. In fact we didn't really see any really easy days at all, barring a couple of unusual ones in the middle (Days 6 and 9). This year it felt like the standard was generally high
Part 2: statistics! Yeah!
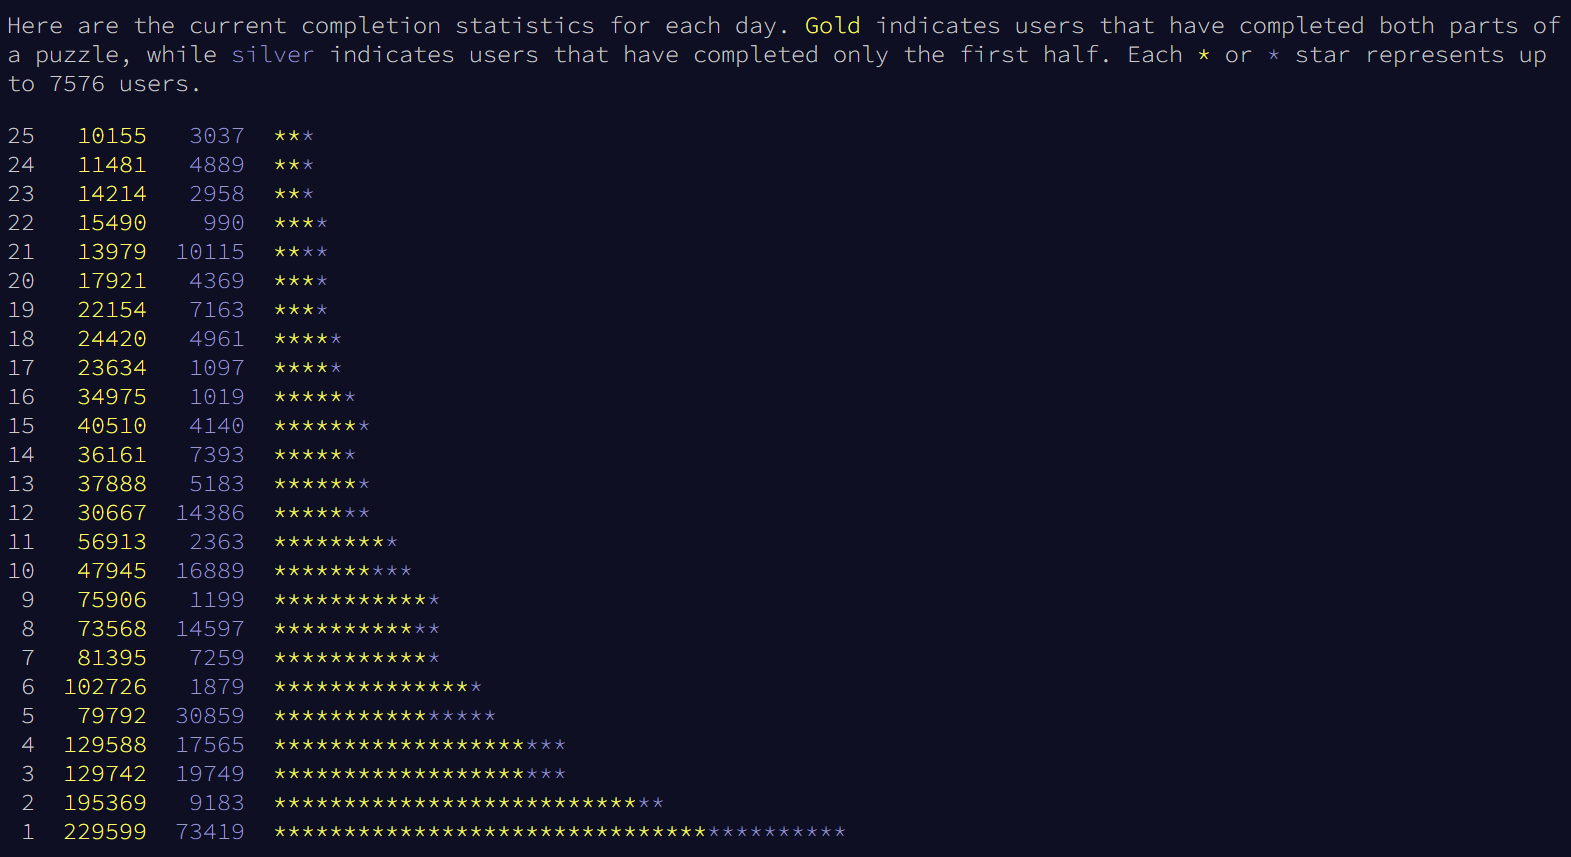
This year, though it's quite easy to identify the "hard" days, by looking at the drop off rate day to day on the global completion stats (Figure 1). Easy Part 2s tend to have high Part 2-to-Part 1 completion ratios (unsurprisingly) and harder days tend to have more significant drops in completion from the day before. Easier days tend to have little to no drop off (there is almost always some drop in completions) except on rare occasions where an increase indicates a particularly accessible day. Days 6, 9, and 15 seem to stand out this year in particular. Although it should be noted these indicate relative difficulty to the previous challenge and this is all correlation not causation. There could be other factors at play and if you find the "easy" days hard or the "hard" days easy, you are not alone, nor are you odd for doing so. This is all subjective.
However, so far we've been looking at the stats and eyeballing the specific stats, but we do have the specific numbers, and we have ways to compare them (Python). We even have the equivalent numbers going all the way back to the start of the Advent of Code in 2015. So let's pause this informal analysis, formalise it, and carry on.
There are 4 statistics we are interested in:
- Total Participants - total number of people completing at least one part each day
- Total Participant Retention - total number of people completing at least one part each day as a fraction of the initial number on Day 1
- Participant Participation Relative to Previous Day - total number of people completing at least one part each day as a percentage of people compared to the number the previous day. E.g. if Day 3 had 3000 people and Day 2 had 1500 people then Day 2 would register as 50%.
- Part 2 Completion Percentage - total number of people that completed part 2 on a given day as the percentage of people that completed any part on that day.
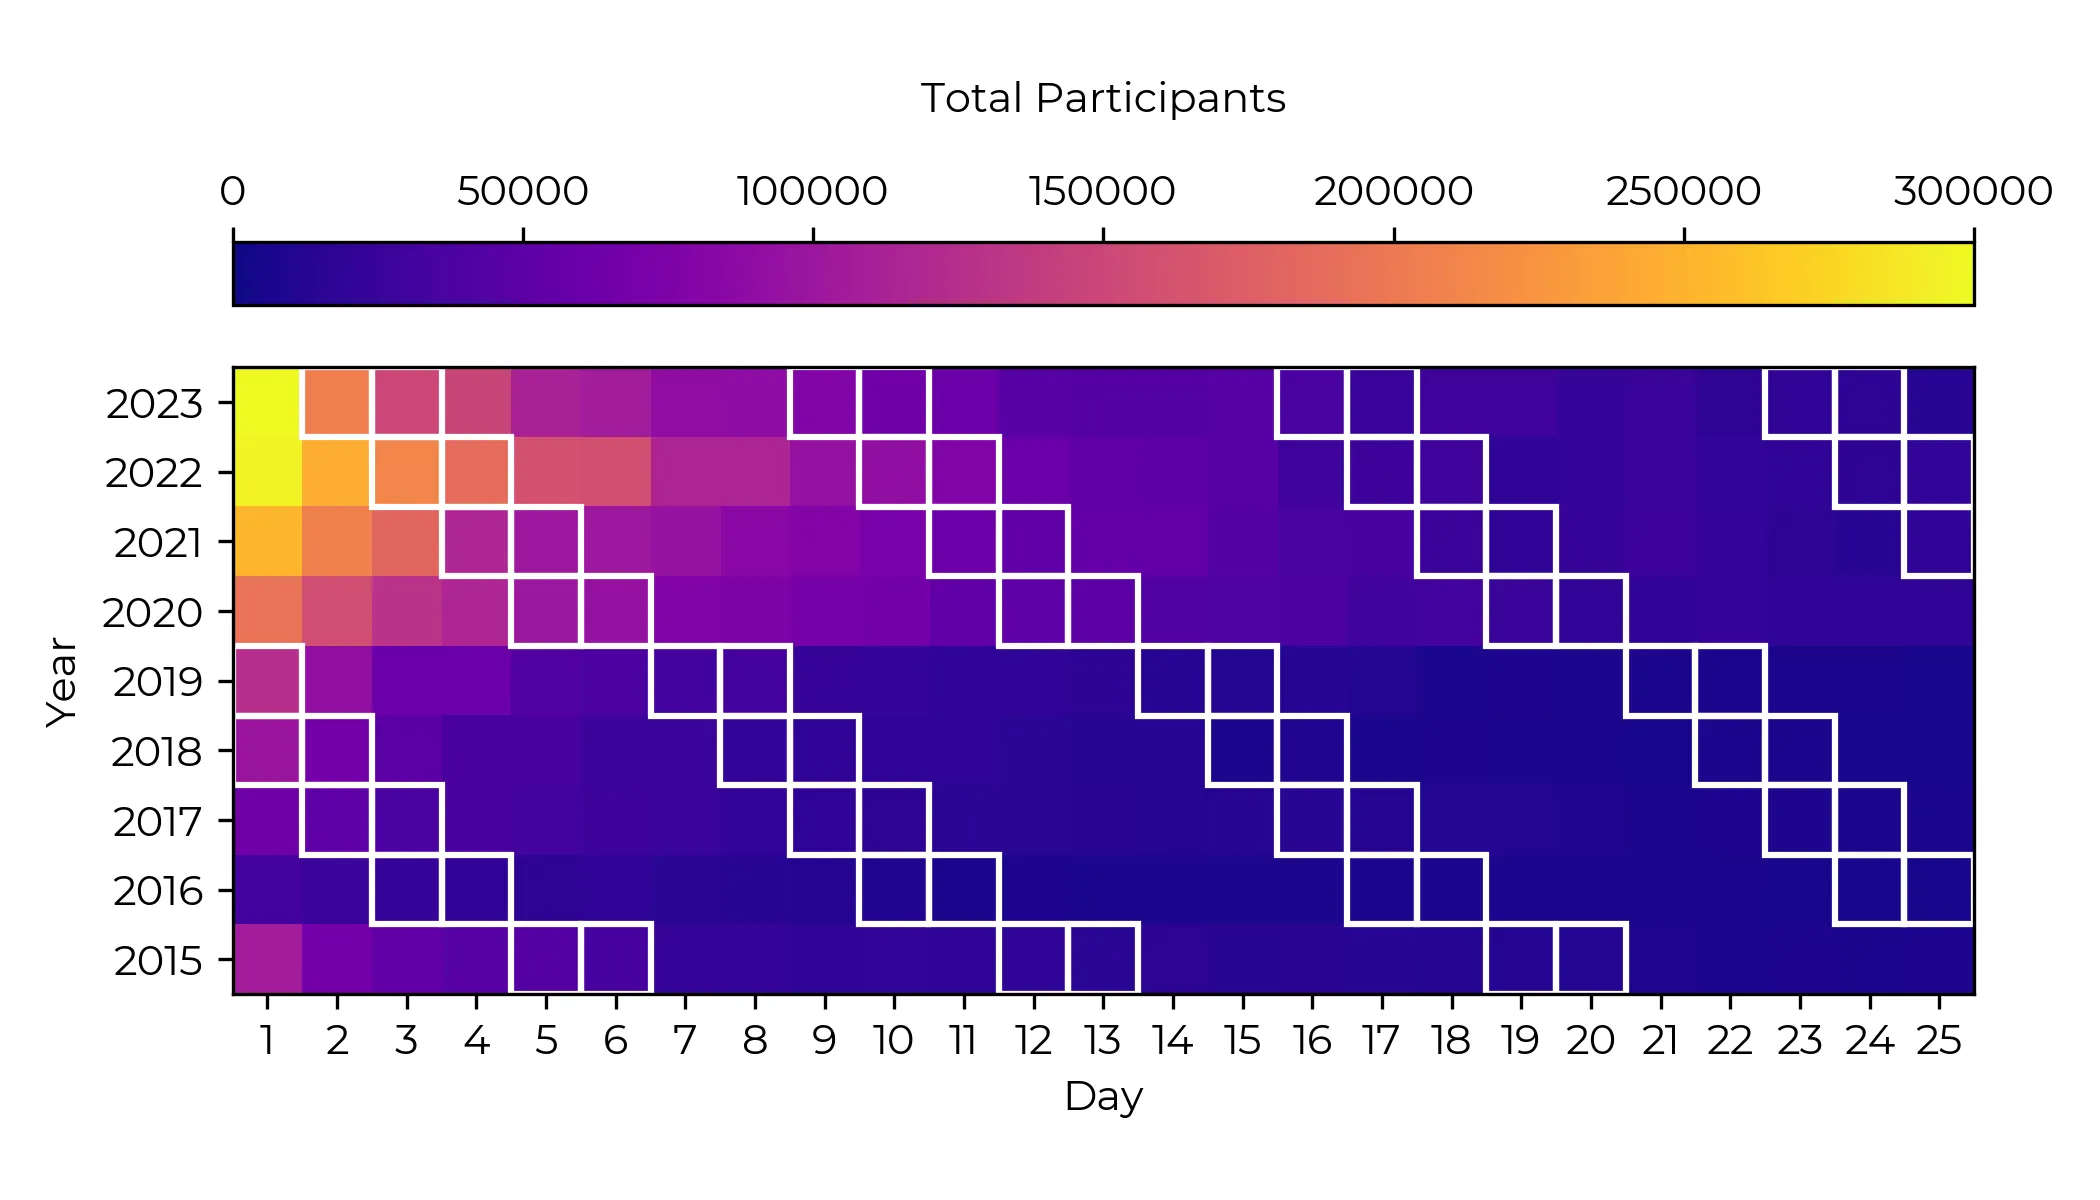
Looking at the raw participation numbers we can see that 2023 and 2022 easily have the highest numbers of any year and it's not even close. Both started off with ~300 000 people completing at least one part of day 1. Although there is more significant drop off in 2023 than 2022 after day 1, which is borne out by the perceived difficulties in the first challenge I mentioned earlier.
Looking back over previous years there seems to be a general increasing trend of participation, year on year with the most significant jump being from 2019/2020 which corresponds to the pandemic and various lockdowns. The popularity of online events like this exploded in 2020. The only stand out result is the significant dip in participants for 2016. My hypothesis for this discrepancy is that people like to start things at the beginning, so people who do AoC for the first time in 2023, or 2018, or any time, are more likely to go back to tackle 2015 next since it is the first year and that if it wasn't for this factor 2015 would look more like 2016. Although given that 2015 and 2017 look pretty similar overall, this might not be a good explanation after all. It could have been a particularly brutal Day 1 challenge that put a lot of people off and given AoC was still in infancy this might have had a bigger effect than it would otherwise. It's hard to say. Although looking at the part 2 completion rate for 2016 day 1 is comparable to 2023 day 1 and 2018 day 1. These 3 are apparently the hardest day 1s so far! See Figure 3.
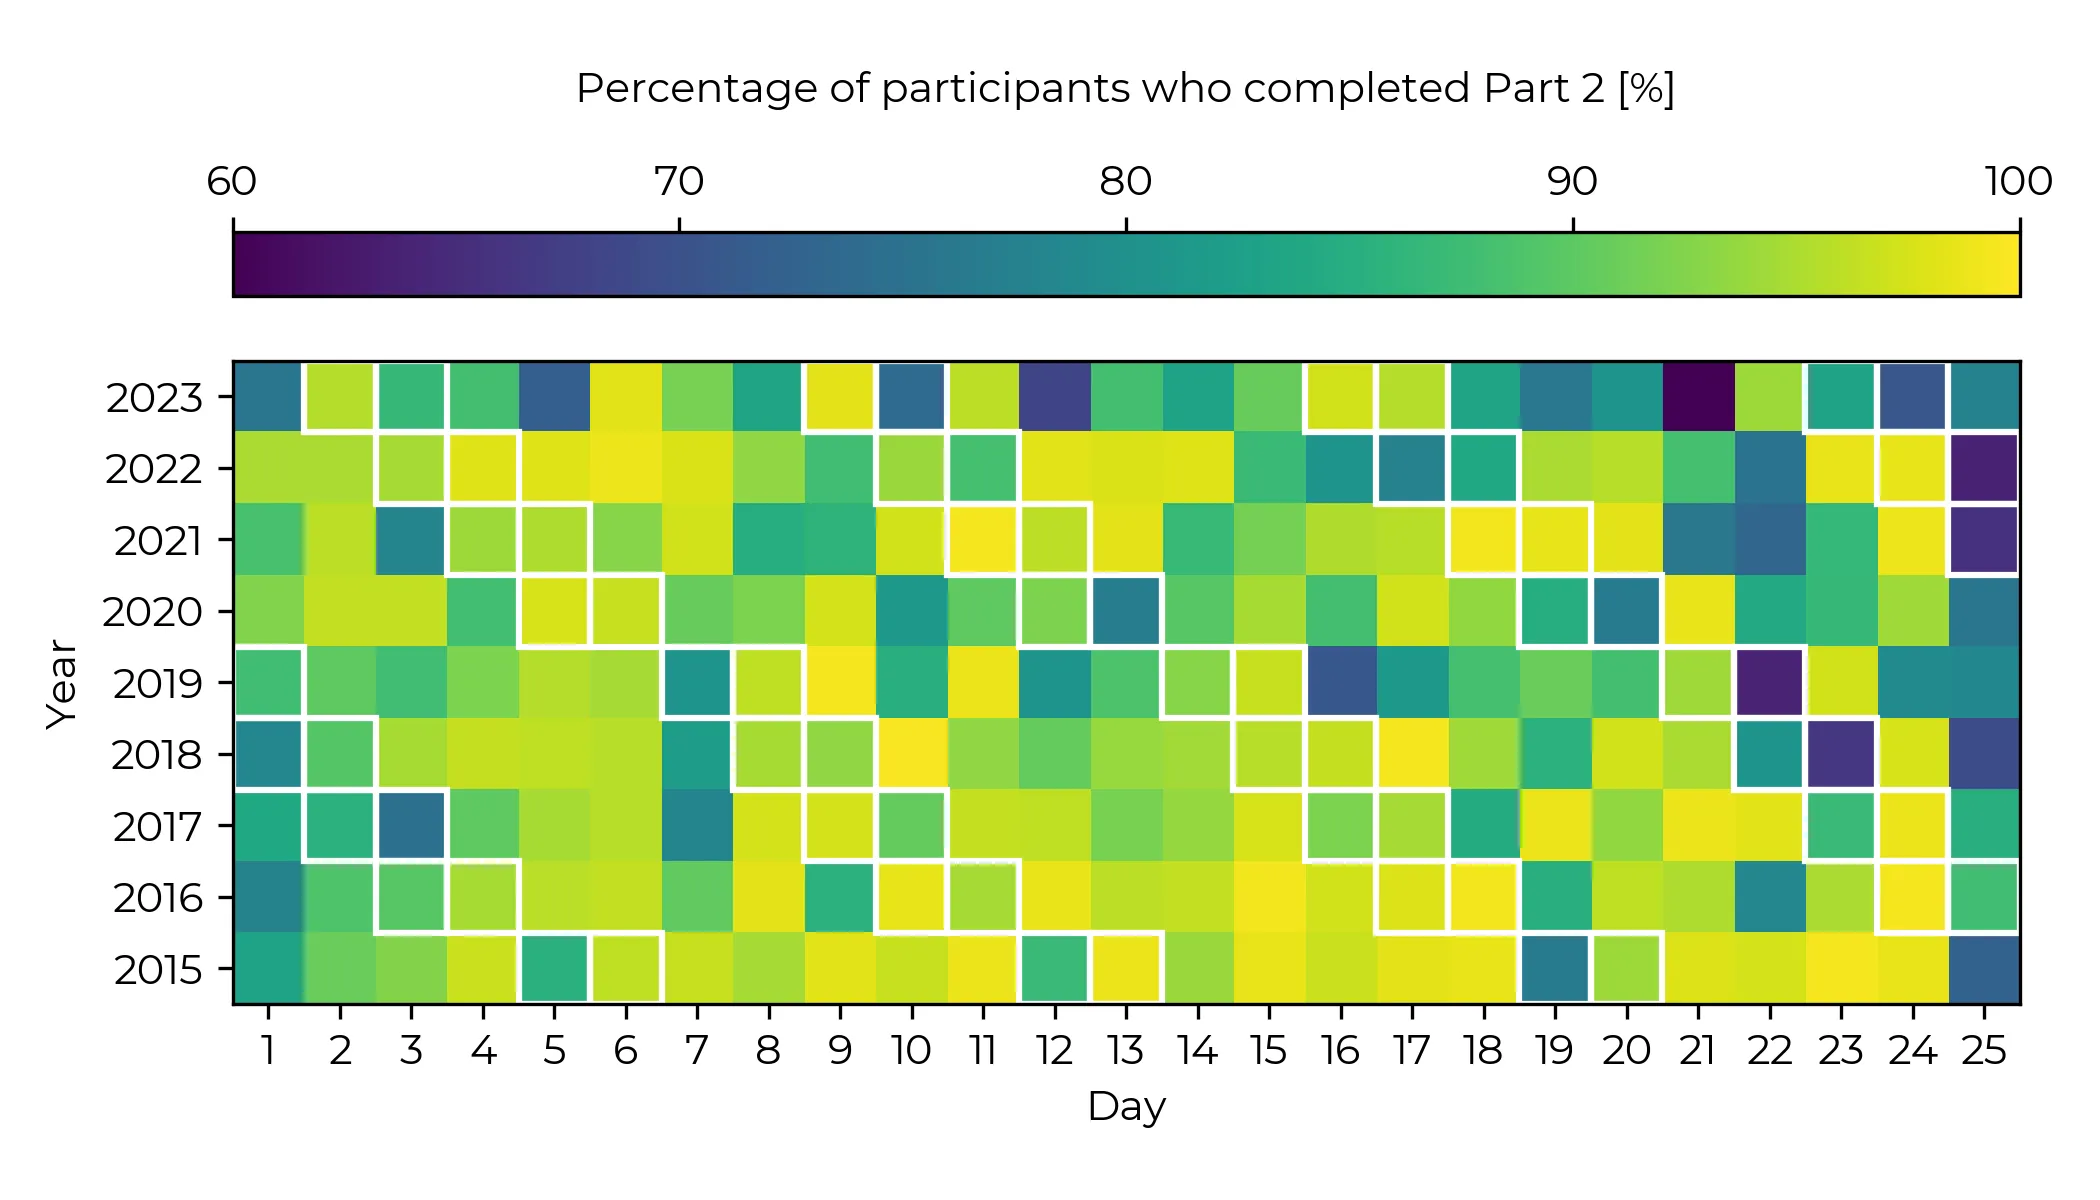
In fact, if we look at the part 2 completion rate relative to the total completions that day over all the days we can arguably get a good idea of the "hardest" day. In general the hardest day should be toward the end, although this isn't guaranteed. It looks like the hardest day in all Advent of Code history was 2023 day 21, in which only 60% of all people who completed a part completed part 2. The only days to come close to this ratio are 2019 day 22 and 2022 Day 25, although the Day 25 part 2 values don't work quite the same way as others so the comparison isn't really valid here (in the Advent of Code you get one free star for part 2 of Day 25, if and only if you have completed all the other challenges that month. So, we can kind of use day 25's completion rate as an indicator of how hard the year's challenges were as a whole. Interestingly this would make 2022 the hardest overall year so far, then 2021, then 2015 and 2018, and 2016 the easiest. Alternatively we can look at the percentage retained from day 1 throughout the month (Figure 4).
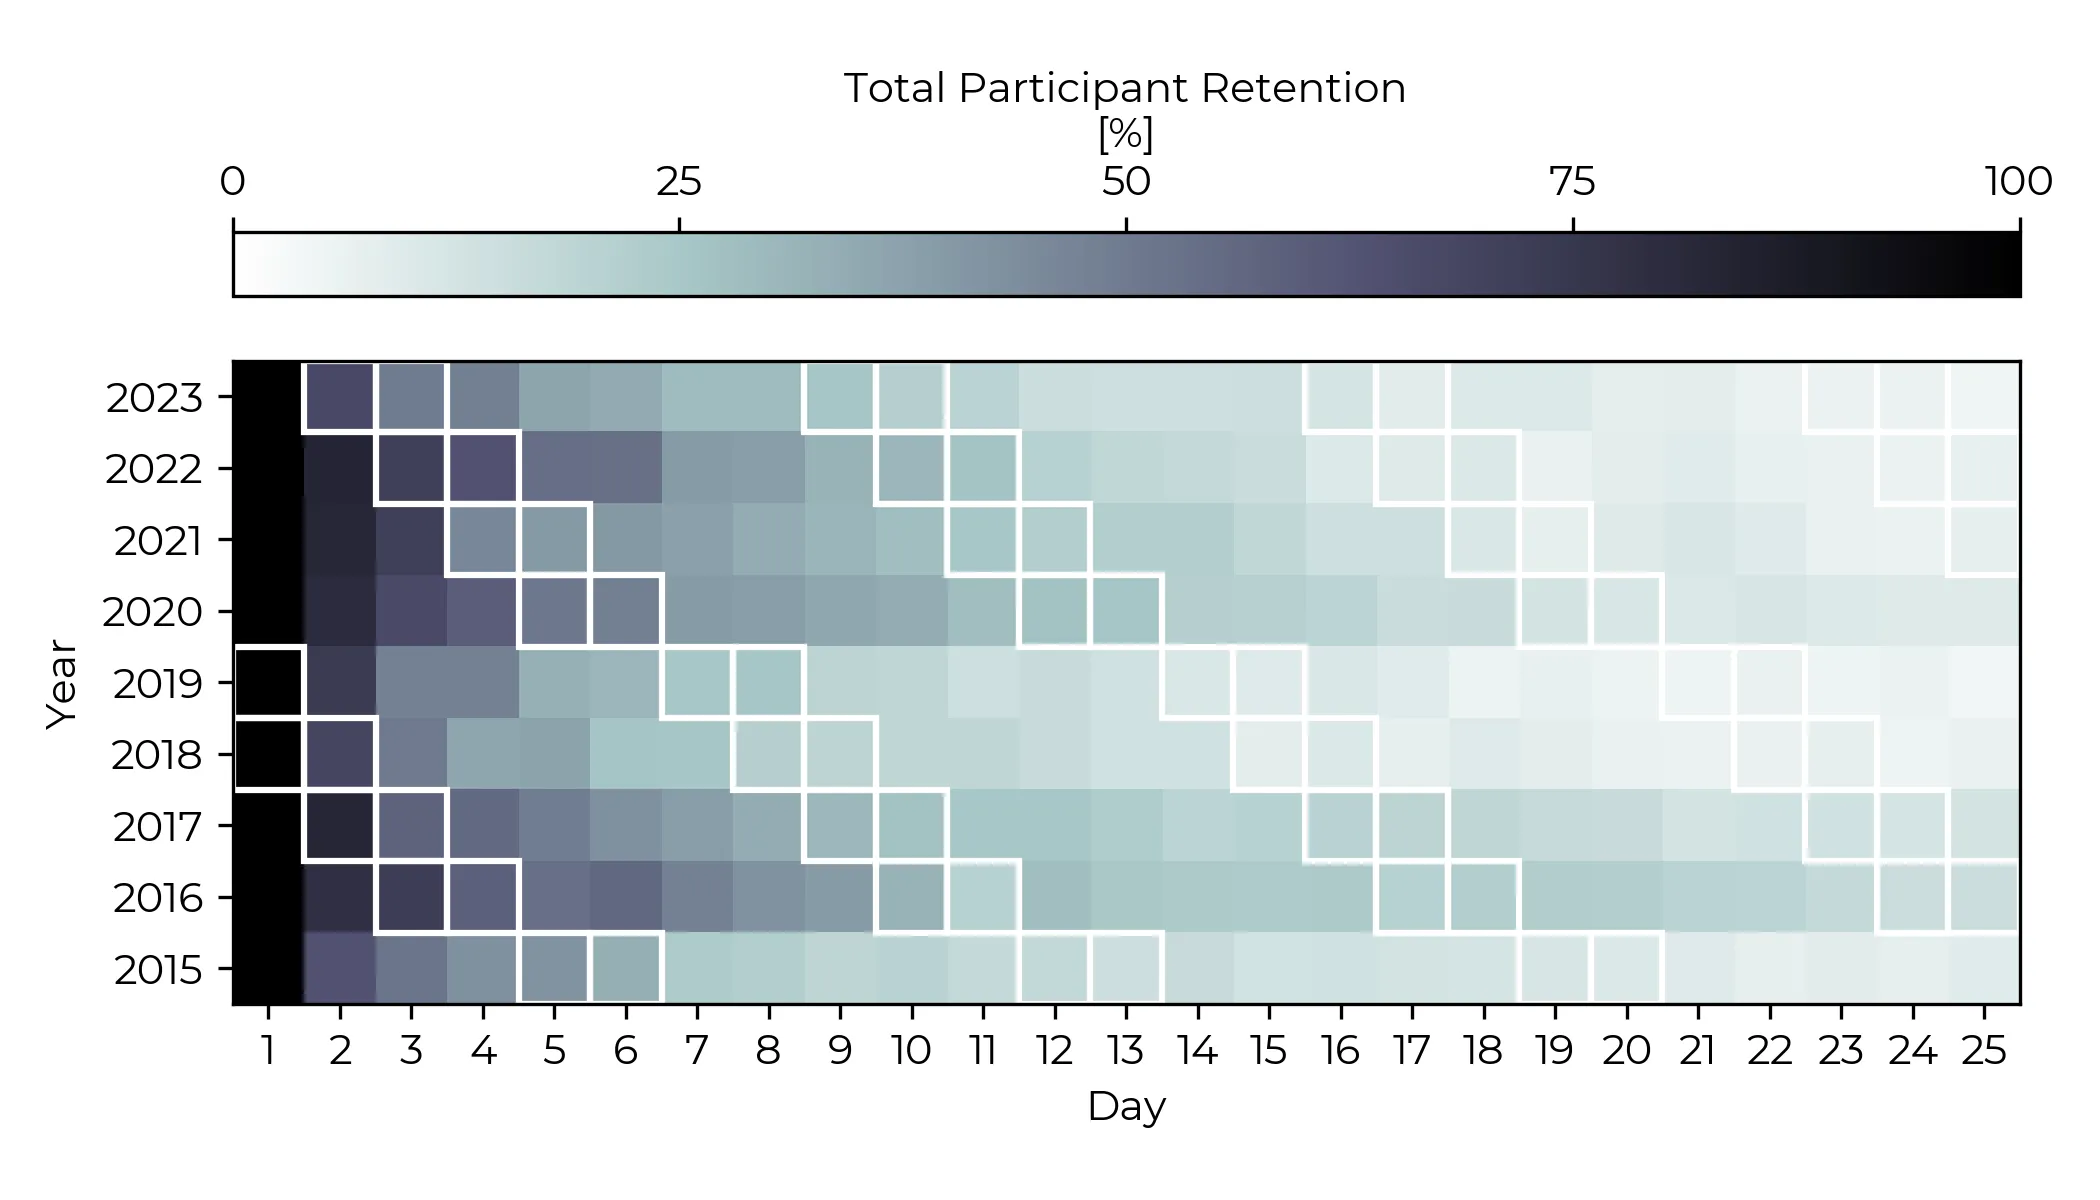
Looking at this figure suggests that this conjecture is incorrect as 2016 has the greatest retention followed by 2017 and 2020. We can also see that generally only 10% of participants ever make it to the end and the most significant drop offs in terms of numbers occur within the first 7 days of the event. And in addition, it doesn't seem like weekends are any more difficult than weekdays. It is a common myth that "harder" problems are saved for the weekends when people have more time, but looking at the data this doesn't seem to be the case. Although the data could be affected by the fact that people tackling the problems on the weekend do have more time and so this removes visual evidence of the effect. Figure 3 seems to corroborate t his with no clear difference between weekends and weekdays although a more serious statistical analysis would be needed to tell for certain.
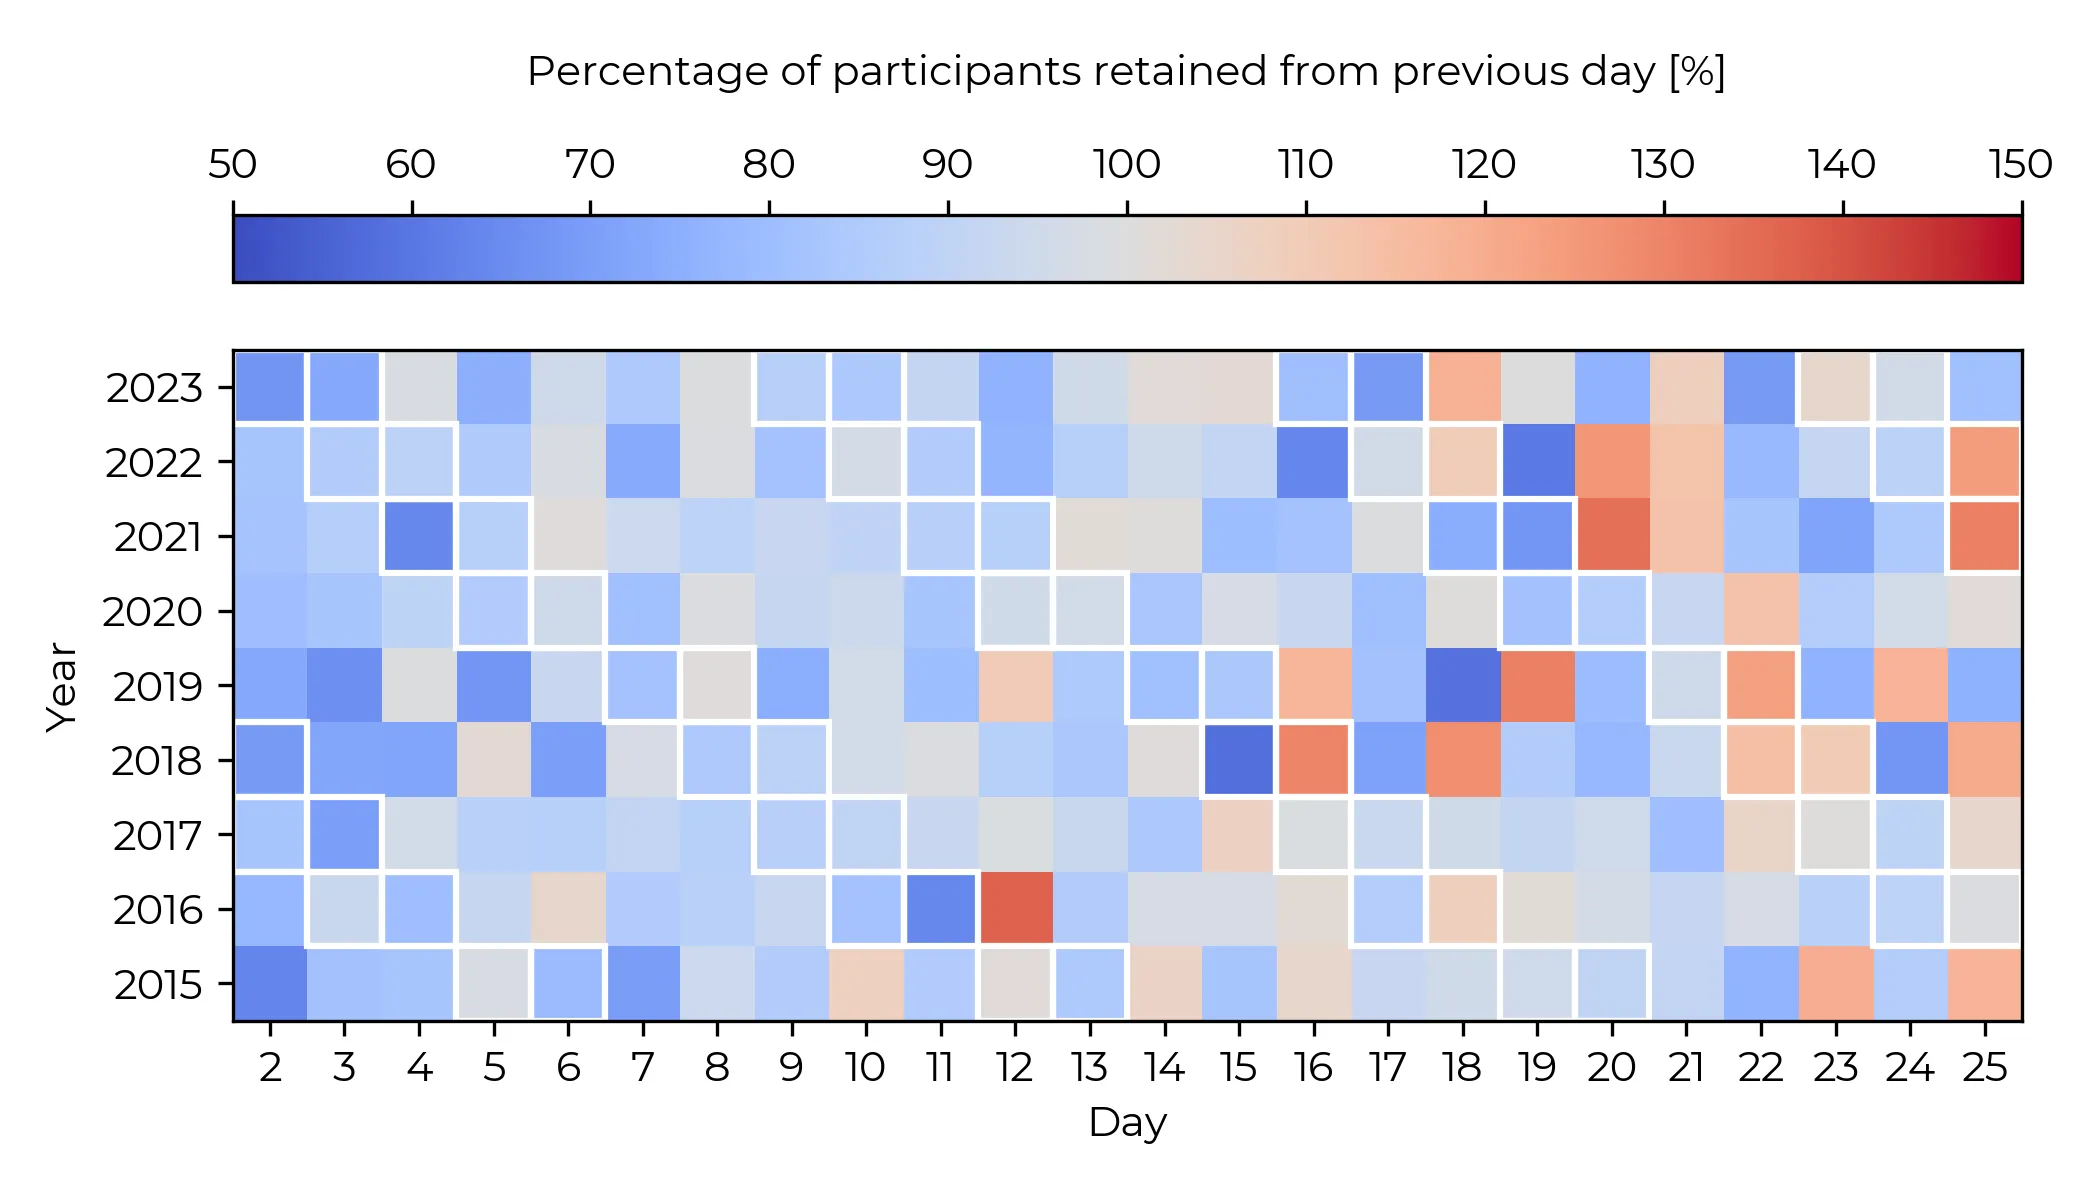
Finally, we can look at the relative retention to the previous day of participants (Figure 5). Red squares indicate an increase in participants and blue represents a decrease. Interestingly there are quite a lot of red squares! There are still more blues overall, but there are some standout days that had a significant draw to increase participants significantly. 2016 day 12 appears to be one such day. 2021 day 20 is in a similar boat. Generally though, we only see red squares in the latter half of advent, which is what we might expect as people are intuitively more likely to check in again closer to Christmas when they have time off. The most significant return appears to be Day 12 in 2016, which suggests that day 11 was really something and the other data seems to agree with this.
Conclusion
Whilst it may have felt harder than previous years it seems like this 2023's advent of code was not significantly different to its predecessors. Although it does appear to be at least comparable to 2018 in terms of the number of difficult days judging by the number of darker days in Figure 3. We also don't see a clear trend of weekends being harder than weekdays. However, we do see that AoC is going from strength to strength, gaining more and more popularity (and infamy) each year.
